
Reporting – Aggregates and Averages
Staffroom includes a tool for calculating aggregate averages for different combinations of marks and different groups of students. The averages tool is flexible and it produces tables of averages as well as a table of mark distributions for the selections made. This page is often used by schools to create ranked “merit lists” for student academic achievement.
Averages Selections
- Select Assess
- Select your year and grade
- Select Analysis > Averages
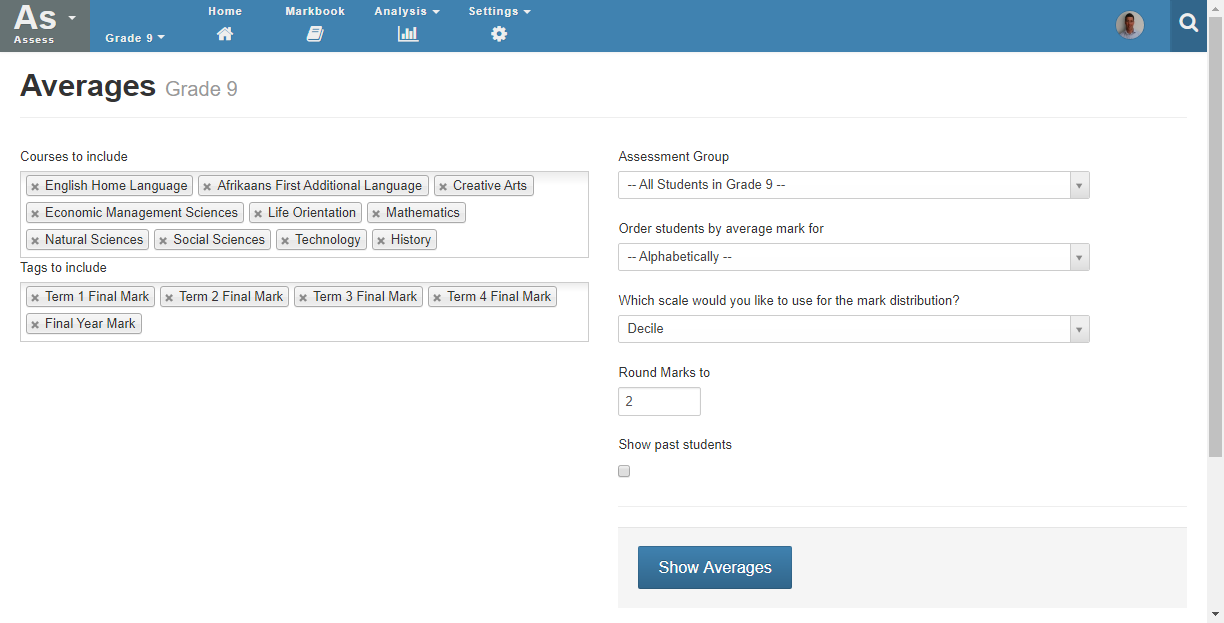
The page allows the following selections:
- Courses that should be included – these are marks from the selected courses will be included in the aggregate averages.
- Tags (marks) to include – these are the term and final marks that you want to include from each course.
- Assessment group – this allows you to select which students marks should be included in the calculations.
- Ordering – allows selection of sort order for students such as:
- Alphabetically by student name
- By average mark for the mark selected (useful when you require ranked order of students from highest to lowest).
- Scale for Mark Distribution
- Rounding – number of decimal places that should be displayed.
- Show past students – include or exclude students who have left the school.
Once the desired selections have been made you should select the “Show Averages” button to perform the averages calculations.
Averages Results
The results of the averages calculations are shown at the bottom of the page beneath the selection fields (you will need to scroll down to see these):

Each of the marks for selected courses and students is displayed along with the aggregate average calculated for that student (in the blue column). The highest and lowest averages are indicated in green and red respectively. Note that the table can be sorted by name or aggregate average value using the selections described above.
Mark Distribution
There is also a mark distribution table that is generated below the averages table.
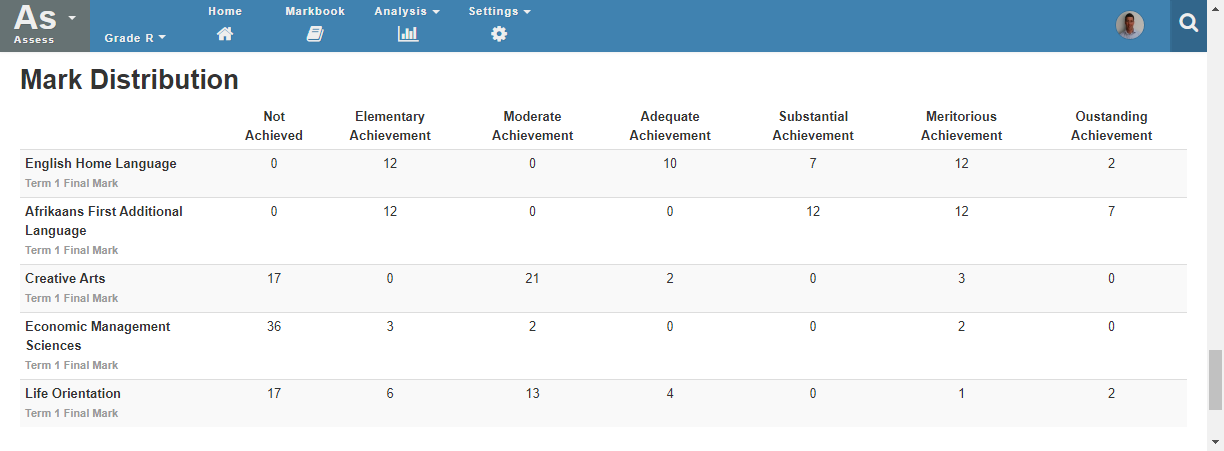
NB: to generate this table for the South African codes 1 – 7 you should select the “SA Codes and Descriptors” option as the distribution scale above.
Can’t see the pages we’re talking about above?
Staffroom features are controlled by permissions so if you can’t see the buttons and screens we are talking about you may need to talk to your Staffroom Administrator.